You should spend about 20 minutes on this task.
The chart below shows the value of one country’s exports in various categories during 2015 and 2016. The table shows the percentage change in each category of exports in 2016 compared with 2015. Summarize the information by selecting and reporting the main features, and make comparisons where relevant.
You should write at least 150 words.
Export Earnings (2015 -2016)

Sample Answer
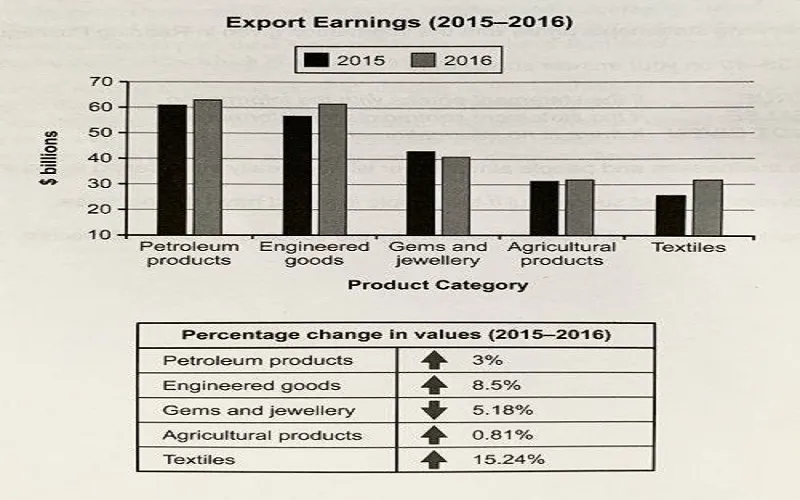
The bar graph compares export earnings of a country in billions of dollars from five different product categories in 2015 and 2016 while the table data outlines the percentage change in export revenue in 2016 than that of the previous year.
Overall, petroleum and engineered products were the main export revenue earners for this country both in 2015 and 2016, and the export amount increased in 2016 than the figure of previous years except for gems and jewellery commodities.
In details, the country earned approximately 220 billion dollars from its export trades in 2015 which increased by around 10 billion dollars next year. In 2015, earning from petroleum export was over 60 billion dollars, the highest amount, while engineered goods brought nearly 58 billion, the second-highest. Next year they made roughly 63 and 62 billion respectively. Jewellery and agricultural products consisted of 70 billion income in 2015 while the textile goods secured around 27 billion, which was the lowest. In 2016, the country exported just over 30 billion dollar’s textile and agro merchandises each, and nearly 40 billion dollar’s jewellery.
Next year, the country gained more export revenue except for jewellery products, revenue from which dropped by nearly 5%. Besides, the export of engineered goods soared by 8.5% while the highest increase was for textile products, over 15%. Finally, it earned 3% and approximately 1% more from petroleum and agricultural merchandises in 2016 than that of 2015.
