• E-mail: [email protected]
  • Listening
    • Cambridge IELTS Tests
    • IELTS Practice Tests
    • Recent Actual Tests
  • Reading
    • Cambridge IELTS Tests
    • IELTS Practice Tests
    • Recent Actual Tests
  • Speaking
    • Speaking Part 1
    • Speaking Part 2
    • Speaking Part 3
  • Writing
    • General Training Writing Task 1
    • Academic Writing Task 1
      • Bar Chart
      • Line Graph
      • Pie Chart
      • Table
      • Map
      • Process Diagram
      • Mixed Charts
    • IELTS Writing Task 2
      • Advantages & Disadvantages Essays
      • Agree or Disagree Essays
      • Discuss Both Views Essays
      • Direct Questions Essays
      • Problems/Causes & Solutions Essays
  • Grammar
  • Vocabulary
    • Speaking Vocabulary
    • Writing Vocabulary
    • Collocation for IELTS
  • IELTS Books
  • Blog
No Result
View All Result
No Result
View All Result
Home IELTS Writing

Projected population growth of China and India

9IELTS by 9IELTS
October 14, 2022
in IELTS Writing, Academic Writing Task 1, Line Graph
Reading Time: 2 mins read
5
VIEWS

» You should spend about 20 minutes on this task.

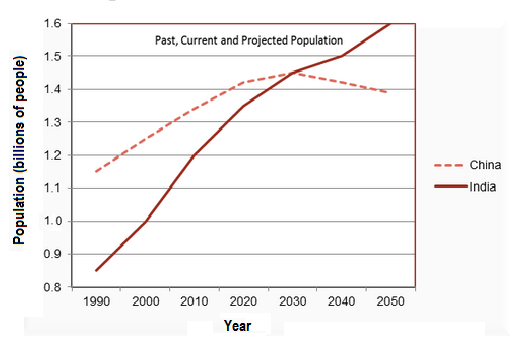
The line graph shows the projected population growth of China and India. Summarise the information by selecting and reporting the main features, and make comparisons where relevant.

» Write at least 150 words.

Projected population growth of China and India

Sample Answer


The line graph depicts the projected population growth of China and India. The X-axis depicts the year and Y-axis depicts the population in billions. The dotted line depicts the trend for China whereas the solid line depicts the population for India.

In the initial phase of 1990, there was a huge difference in the population of India and China. In the subsequent years both the countries saw a steady increase in the population. Though India had a maximum of 1.6 billion populations compared to 1.45 billion of China. There was also an interesting trend in the increase of China’s population. It is projected that it will start declining after 2030 after a steady increase till the same year.

The two lines depicting the population of both the countries intersect each other in 2030 which implies that the population remained same during this year. The lowest population that India and China encountered was in 1990 though the number was much higher for China. The highest population will be noticed in 2050 for India and 2030 for China.

Overall India saw a more serious increase in population and trends show that it will have difficulty in controlling it whereas China will show a positive trend after 2030 by showing a decline in population.

[ Written by – Shubhendu Shekhar ]

Previous Post

Village of Stokeford in 1930 and 2010

Next Post

British people giving money to charity by age range

Leave a Reply

Your email address will not be published. Required fields are marked *

POPULAR POSTS

Does renting a house have more advantages or disadvantages

Some people think sports are important for society

School should prepare students for university rather than work

IELTS Listening Recent Actual Test 25

IELTS Listening Practice Test 21

Social networking sites have a huge negative impact

Describe a person who has apologised to you

Governments should give financial support to creative artists such as painters and musicians

Should travelling be included in the education

In some countries it is thought advisable that children begin formal education at four years old

About Us

9IELTS

9IELTS is dedicated to providing free materials and resources for IELTS conquerors. Stay constantly updated with a wide range of ultimate tips, strategies, and practice tests to crack the high-stakes IELTS exam!

Recent Posts

Percentages of home schooled students

We have become more independent in modern world

Describe someone you would like to study or work with

IELTS Reading Practice Test 310

Describe a person you know who gave a clever solution to a problem

Disclaimer

The information on this site is for informational purposes only. IELTS is a registered trademark of the University of Cambridge ESOL, the British Council, and IDP Education Australia. This site and its owner are not affiliated, approved or endorsed by University of Cambridge ESOL, the British Council, or IDP Education Australia.
  • About Us
  • Contact Us
  • Disclaimer
  • Terms & Conditions
  • Privacy Policy

Copyright © 2023 9IELTS. All Rights Reserved.

No Result
View All Result
  • Listening
    • Cambridge IELTS Tests
    • IELTS Practice Tests
    • Recent Actual Tests
  • Reading
    • Cambridge IELTS Tests
    • IELTS Practice Tests
    • Recent Actual Tests
  • Speaking
    • Speaking Part 1
    • Speaking Part 2
    • Speaking Part 3
  • Writing
    • General Training Writing Task 1
    • Academic Writing Task 1
      • Bar Chart
      • Line Graph
      • Pie Chart
      • Table
      • Map
      • Process Diagram
      • Mixed Charts
    • IELTS Writing Task 2
      • Advantages & Disadvantages Essays
      • Agree or Disagree Essays
      • Discuss Both Views Essays
      • Direct Questions Essays
      • Problems/Causes & Solutions Essays
  • Grammar
  • Vocabulary
    • Speaking Vocabulary
    • Writing Vocabulary
    • Collocation for IELTS
  • IELTS Books
  • Blog

Copyright © 2023 9IELTS. All Rights Reserved.

This site uses cookies to offer you a better browsing experience. By continuing to use this website, you agree to our Privacy Policy.