• E-mail: [email protected]
  • Listening
    • Cambridge IELTS Tests
    • IELTS Practice Tests
    • Recent Actual Tests
  • Reading
    • Cambridge IELTS Tests
    • IELTS Practice Tests
    • Recent Actual Tests
  • Speaking
    • Speaking Part 1
    • Speaking Part 2
    • Speaking Part 3
  • Writing
    • General Training Writing Task 1
    • Academic Writing Task 1
      • Bar Chart
      • Line Graph
      • Pie Chart
      • Table
      • Map
      • Process Diagram
      • Mixed Charts
    • IELTS Writing Task 2
      • Advantages & Disadvantages Essays
      • Agree or Disagree Essays
      • Discuss Both Views Essays
      • Direct Questions Essays
      • Problems/Causes & Solutions Essays
  • Grammar
  • Vocabulary
    • Speaking Vocabulary
    • Writing Vocabulary
    • Collocation for IELTS
  • IELTS Books
  • Blog
No Result
View All Result
No Result
View All Result
Home IELTS Writing

The consumption of regular ice cream in the US market

9IELTS by 9IELTS
October 13, 2022
in IELTS Writing, Academic Writing Task 1, Bar Chart
Reading Time: 2 mins read
5
VIEWS

You should spend about 20 minutes on this task.

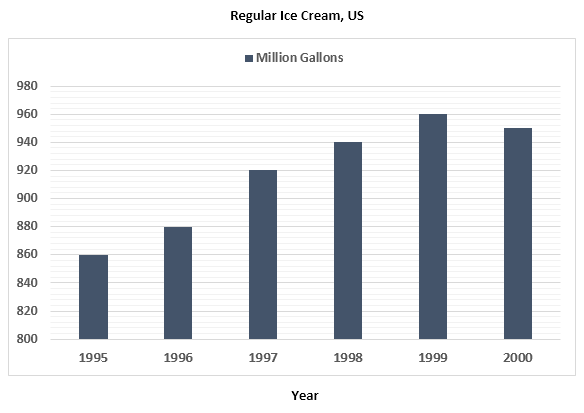
The column graph below shows the consumption of regular ice cream in the US market.

coconsumption-of-regular-ice-cream-in-the-usnsumption-of-regular-ice-cream-in-the-us

Summarise the information by selecting and reporting the main features and make comparisons where relevant.

Write at least 150 words.

Sample Answer

The column graph shows yearly ice cream consumption in the USA from 1995 to 2000. The unit is given in million gallons, and the consumption includes regular ice creams in the US market. Overall, the ice cream intake by US citizens increased over the years, and this consumption was the highest in the year 1999.

According to the illustration, American citizens ate 860 million gallons of regular ice cream in 1995, which increased by 20 million gallons in the next year.  The consumption further increased in the next three years, with an average increase of 20 million gallons each year. In 1999, ice cream consumption by US citizens stood at 960, which was 100 million gallons higher than the consumption in 1995.

After 1999, the intake of regular ice cream dropped by approximately 10 million gallons, which was an exception to the trend shown in the bar graph. This is the only year when ice cream consumption by Americans decreased compared to the previous year.

Previous Post

Number of applicants and students who were granted admission

Next Post

Online shopping sales for retail sectors in Australia

Leave a Reply

Your email address will not be published. Required fields are marked *

POPULAR POSTS

IELTS Reading Practice Test 45

Men do most of the high level jobs

Information on global population figures and figures for urban populations in different world regions

The different modes of transport used to travel to and from work in one European city

Television is a very useful tool when it comes to education

Heart Attacks by Ages and Genders in USA

Cambridge IELTS Trainer 1 + 2 [PDF + Audio]

Describe a city or a town where you live or lived

Australia urges Indonesia not to execute drug smugglers

Procedure for university entry for high school graduates

About Us

9IELTS

9IELTS is dedicated to providing free materials and resources for IELTS conquerors. Stay constantly updated with a wide range of ultimate tips, strategies, and practice tests to crack the high-stakes IELTS exam!

Recent Posts

Describe a teacher from your past that you remember

IELTS Reading Recent Actual Test 26

Nowadays people live in the society where consumer goods are cheaper to buy

Pulse rate changes between two different individuals

Letter writing could be lost in the future

Disclaimer

The information on this site is for informational purposes only. IELTS is a registered trademark of the University of Cambridge ESOL, the British Council, and IDP Education Australia. This site and its owner are not affiliated, approved or endorsed by University of Cambridge ESOL, the British Council, or IDP Education Australia.
  • About Us
  • Contact Us
  • Disclaimer
  • Terms & Conditions
  • Privacy Policy

Copyright © 2023 9IELTS. All Rights Reserved.

No Result
View All Result
  • Listening
    • Cambridge IELTS Tests
    • IELTS Practice Tests
    • Recent Actual Tests
  • Reading
    • Cambridge IELTS Tests
    • IELTS Practice Tests
    • Recent Actual Tests
  • Speaking
    • Speaking Part 1
    • Speaking Part 2
    • Speaking Part 3
  • Writing
    • General Training Writing Task 1
    • Academic Writing Task 1
      • Bar Chart
      • Line Graph
      • Pie Chart
      • Table
      • Map
      • Process Diagram
      • Mixed Charts
    • IELTS Writing Task 2
      • Advantages & Disadvantages Essays
      • Agree or Disagree Essays
      • Discuss Both Views Essays
      • Direct Questions Essays
      • Problems/Causes & Solutions Essays
  • Grammar
  • Vocabulary
    • Speaking Vocabulary
    • Writing Vocabulary
    • Collocation for IELTS
  • IELTS Books
  • Blog

Copyright © 2023 9IELTS. All Rights Reserved.

This site uses cookies to offer you a better browsing experience. By continuing to use this website, you agree to our Privacy Policy.