The movement of people from rural to urban areas in three countries and predictions for future years
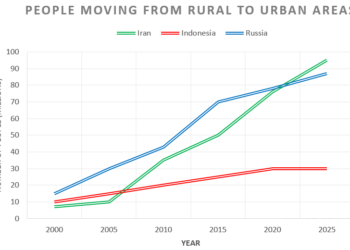
You should spend about 20 minutes on this task. The chart below shows the movement of people from rural to urban areas in...
You should spend about 20 minutes on this task. The chart below shows the movement of people from rural to urban areas in...
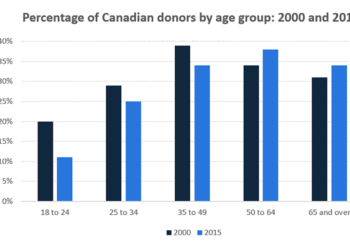
You should spend about 20 minutes on this task. The chart below gives information on the percentage of Canadians gave money to charitable...
You should spend about 20 minutes on this task. The graph shows data on the manufacture of passenger cars in 2015. Summarise the...
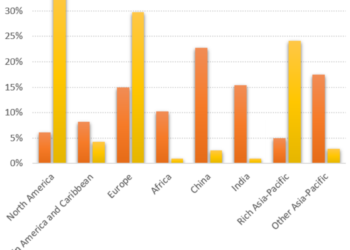
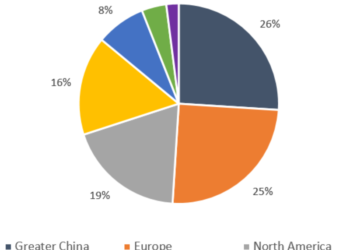
You should spend about 20 minutes on this task. The chart below gives information about global population percentages and distribution of wealth by...
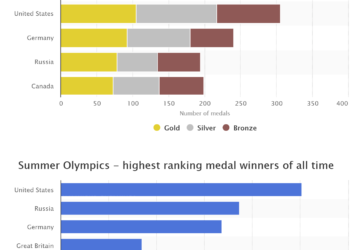
You should spend about 20 minutes on this task. The graphs below show the number of medals won by the top five countries...
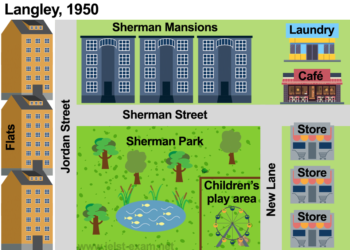
You should spend about 20 minutes on this task. The maps below show the town of Langley in 1910 and 1950. Summarise the...
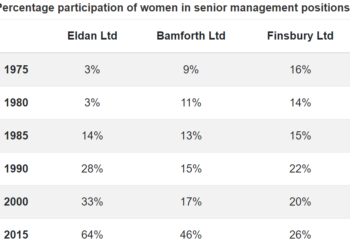
You should spend about 20 minutes on this task. The table below shows the percentage participation of women in senior management in three...
You should spend about 20 minutes on this task. The bar graphs below show the Riverdale Public School’s spending per student in a...
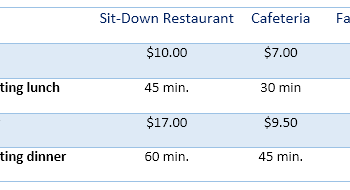
» You should spend about 20 minutes on this task. The table below shows information about three different types of restaurants. Summarise the...
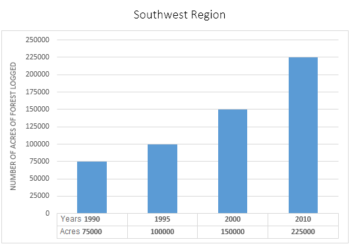
» You should spend about 20 minutes on this task. The bar graph below shows the area of forest logged in Southwest region...
9IELTS is dedicated to providing free materials and resources for IELTS conquerors. Stay constantly updated with a wide range of ultimate tips, strategies, and practice tests to crack the high-stakes IELTS exam!