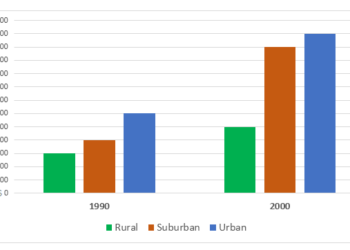
Average cost of housing in three different areas
» You should spend about 20 minutes on this task. The graph below shows the average cost of housing in three different areas....
» You should spend about 20 minutes on this task. The graph below shows the average cost of housing in three different areas....
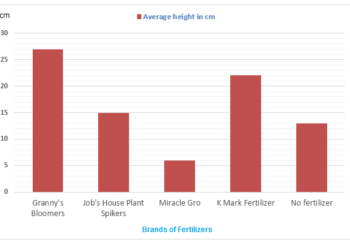
You should spend about 20 minutes on this task. The graph below shows the effects of different brands of fertilizer on bean plant...
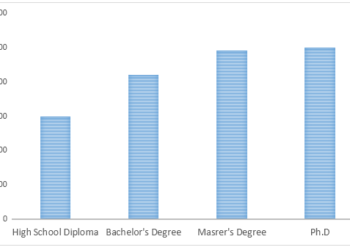
» You should spend about 20 minutes on this task. The graph below shows the average salaries earned by people with different levels...
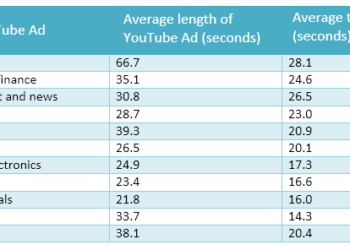
» You should spend about 20 minutes on this task. The table below shows types of YouTube ads, their average lengths and how...
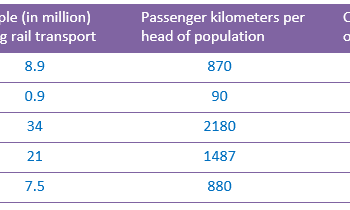
» You should spend about 20 minutes on this task. The table below gives information about the rail transport in five countries in...
» You should spend about 20 minutes on this task. The line graph below gives information about men and women smokers in Bhutan...
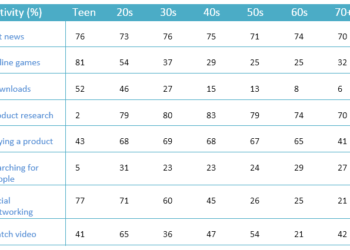
» You should spend about 20 minutes on this task. The table below gives information about online activities of people in different age...
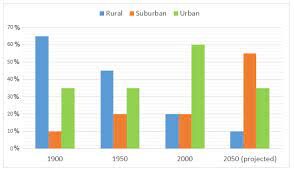
» You should spend about 20 minutes on this task. The graph below shows the figures for population distribution in the Northwest Region...
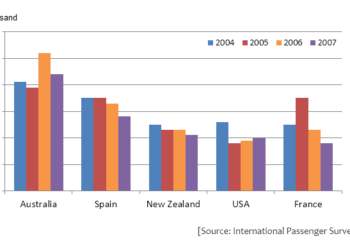
» You should spend about 20 minutes on this task. The chart shows British Emigration to selected destinations between 2004 and 2007. Summarise...
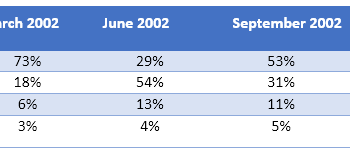
» You should spend about 20 minutes on this task. The chart below shows the results of a survey that sampled a cross...
9IELTS is dedicated to providing free materials and resources for IELTS conquerors. Stay constantly updated with a wide range of ultimate tips, strategies, and practice tests to crack the high-stakes IELTS exam!