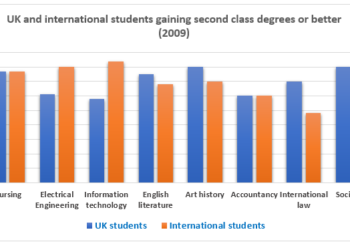
Percentage of international and UK students gaining second class degrees
» You are advised to spend about 20 minutes on this task. The graph compares the percentage of international and the percentage of UK students...
» You are advised to spend about 20 minutes on this task. The graph compares the percentage of international and the percentage of UK students...
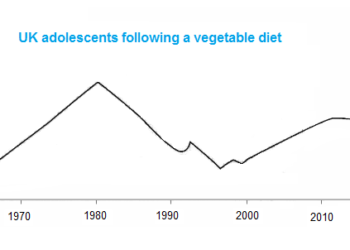
» You are advised to spend about 20 minutes on this task. The graph shows the percentage of UK adolescents following a vegetarian diet. Summarise...
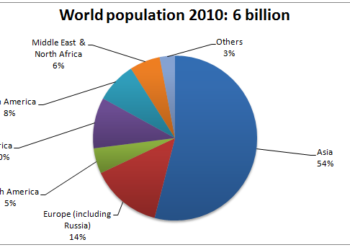
» You are advised to spend about 20 minutes on this task. The two pie charts below show changes in world population by region between 1910...
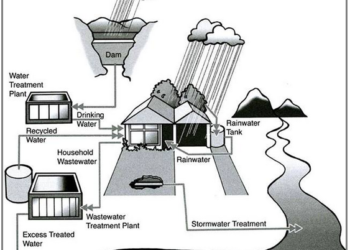
» You are advised to spend about 20 minutes on this task. The following diagram shows how rainwater is reused for domestic purposes. Summarise the information...
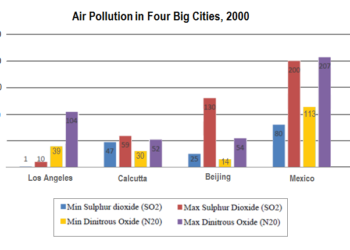
» You are advised to spend about 20 minutes on this task. The chart below shows the average daily minimum and maximum levels of two air...
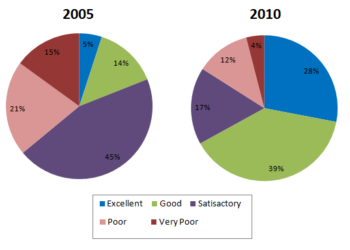
» You are advised to spend about 20 minutes on this task. The charts below show the results of a questionnaire that asked visitors to the...
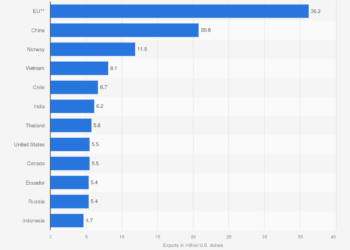
» You are advised to spend about 20 minutes on this task. The graph and table below show the number of fishers in millions for different...
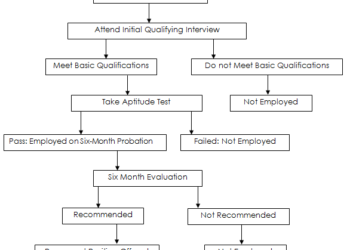
» You are advised to spend about 20 minutes on this task. The diagram below shows the steps in the hiring process at ACME corporation. Summarise...
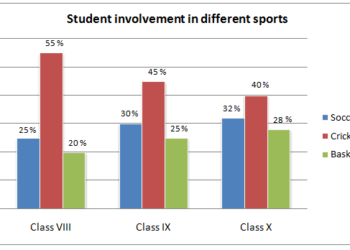
» You are advised to spend about 20 minutes on this task. The graph below shows the student involvement in three sports in a school based...
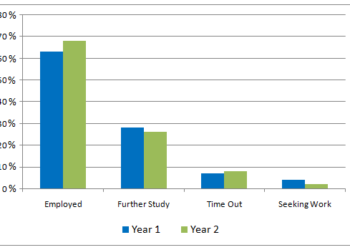
You are advised to spend about 20 minutes on this task. The charts below show what the business and engineering graduates of a particular university...
9IELTS is dedicated to providing free materials and resources for IELTS conquerors. Stay constantly updated with a wide range of ultimate tips, strategies, and practice tests to crack the high-stakes IELTS exam!