The differences in wheat exports over three different areas
You should spend about 20 minutes on this task. The graph below shows the differences in wheat exports over three different areas. Write...
You should spend about 20 minutes on this task. The graph below shows the differences in wheat exports over three different areas. Write...
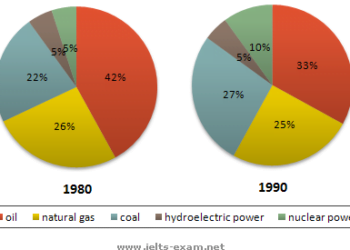
You should spend about 20 minutes on this task. The two graphs show the main sources of energy in the USA in the...
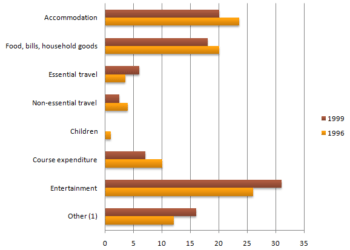
You should spend about 20 minutes on this task. The chart shows student expenditure over a three-year period in the United Kingdom. Summarise...
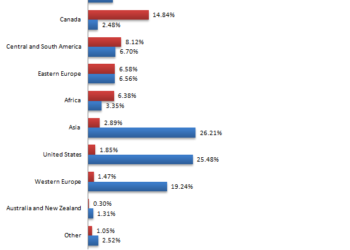
You should spend about 20 minutes on this task. The chart below shows the proportions of the world’s oil resources held in different...
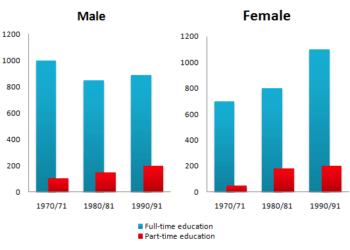
You should spend about 20 minutes on this task. The chart below shows the number of men and women in further education in...
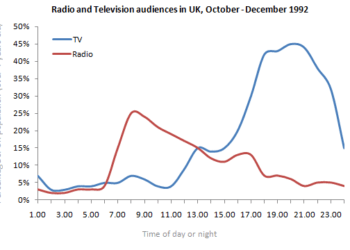
You should spend about 20 minutes on this task. The graph below shows radio and television audiences throughout the day in 1992. Write...
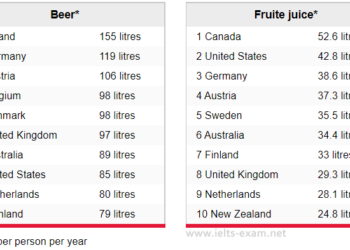
You should spend about 20 minutes on this task. The tables below give information about the amount of beer and fruit juice consumed...
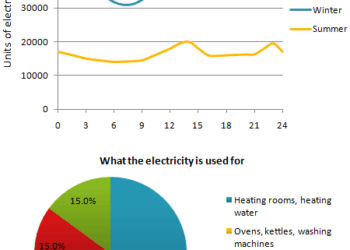
You should spend about 20 minutes on this task. The graph below shows the demand for electricity in England during typical days in...
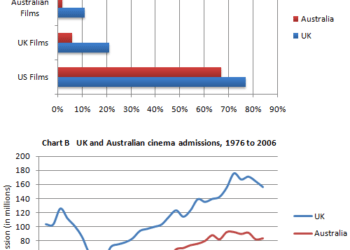
You should spend about 20 minutes on this task. The charts A and B show the share of the UK and Australian cinema...
You should spend about 20 minutes on this task. The chart below shows information about the challenges people face when they go to...
9IELTS is dedicated to providing free materials and resources for IELTS conquerors. Stay constantly updated with a wide range of ultimate tips, strategies, and practice tests to crack the high-stakes IELTS exam!