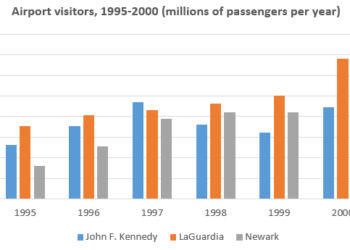
The number of travellers using three major airports in New York City
You should spend about 20 minutes on this task. The chart below shows the number of travellers using three major airports in New...
You should spend about 20 minutes on this task. The chart below shows the number of travellers using three major airports in New...
You should spend about 20 minutes on this task. The Table below shows the results of a survey that asked 6800 Scottish adults...

You should spend about 20 minutes on this task. The diagram below shows the production of electricity using a system called Ocean Thermal...
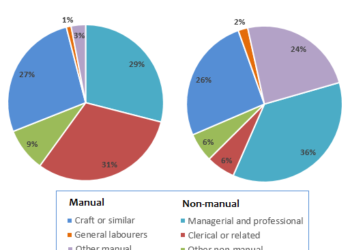
You should spend about 20 minutes on this task. The two pie charts below show some employment patterns in Great Britain in 1992....
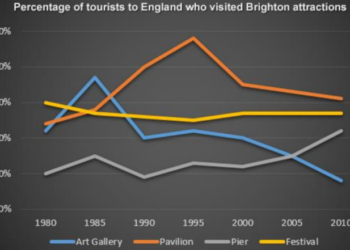
You should spend about 20 minutes on this task. The line graph below shows the percentage of tourists to England who visited four...
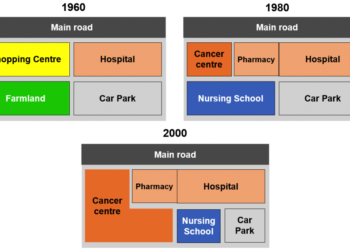
You should spend about 20 minutes on this task. The maps below show the changes that have taken place at Queen Mary Hospital...
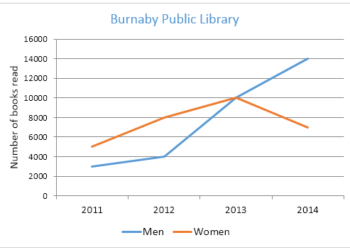
You should spend about 20 minutes on this task. The graph below shows the number of books read by men and women at...
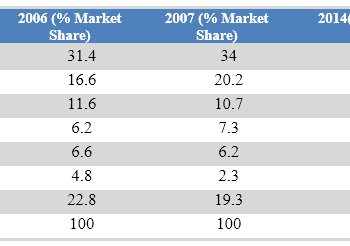
You should spend about 20 minutes on this task. The table below shows the worldwide market share of the notebook computer market for...
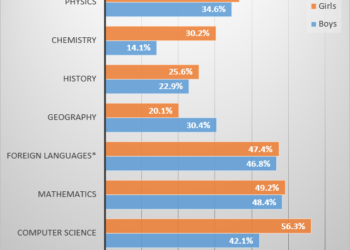
You should spend about 20 minutes on this task. The bar chart below shows the percentage of students who passed their high school...
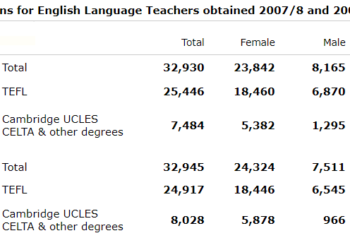
You should spend about 20 minutes on this task. The table below shows the number of students living in the UK gaining English...
9IELTS is dedicated to providing free materials and resources for IELTS conquerors. Stay constantly updated with a wide range of ultimate tips, strategies, and practice tests to crack the high-stakes IELTS exam!