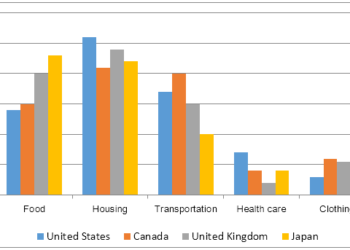
Shares of expenditures for five major categories
You should spend about 20 minutes on this task. The bar chart below shows shares of expenditures for five major categories in the...
You should spend about 20 minutes on this task. The bar chart below shows shares of expenditures for five major categories in the...
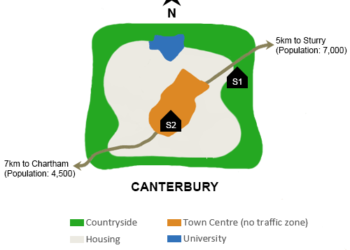
You should spend about 20 minutes on this task. The map below is of the town of Canterbury. A new school (S) is...
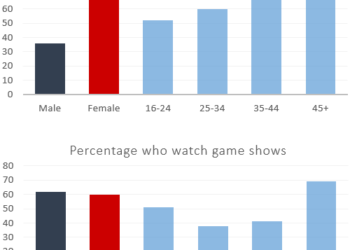
You should spend about 20 minutes on this task. The charts give information about two genres of TV programmes watched by men and...
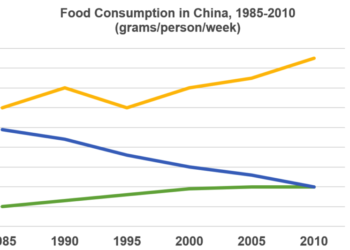
You should spend about 20 minutes on this task. The graph below shows the changes in food consumption by Chinese people between 1985...
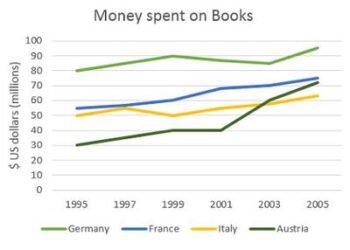
You should spend about 20 minutes on this task. The graph below shows the amount of money spent on books in Germany, France,...
You should spend about 20 minutes on this task. The three pie charts below show the changes in annual spending by local authorities...
You should spend about 20 minutes on this task. The table below shows the cinema viewing figures for films by country, in millions....
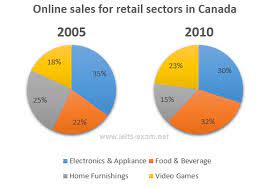
You should spend about 20 minutes on this task. The two pie charts below show the online shopping sales for retail sectors in...
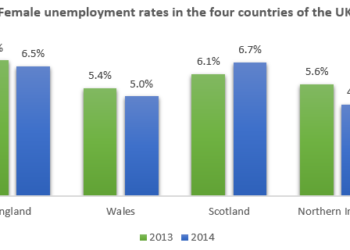
You should spend about 20 minutes on this task. The graph below shows female unemployment rates in each country of the United Kingdom...
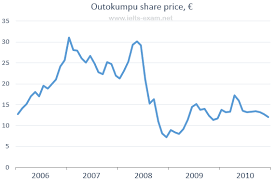
You should spend about 20 minutes on this task. The line graph below shows the changes in the share price of Outokumpu companies...
9IELTS is dedicated to providing free materials and resources for IELTS conquerors. Stay constantly updated with a wide range of ultimate tips, strategies, and practice tests to crack the high-stakes IELTS exam!