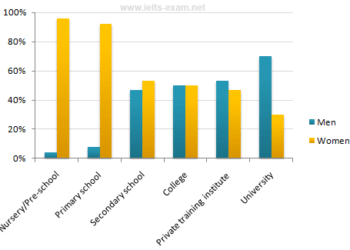
The percentage of male and female teachers in six different types of educational setting
You should spend about 20 minutes on this task. The chart below shows the percentage of male and female teachers in six different...
You should spend about 20 minutes on this task. The chart below shows the percentage of male and female teachers in six different...
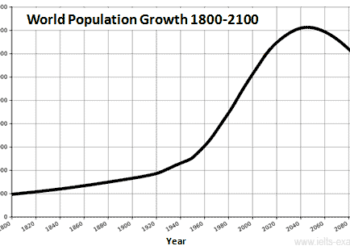
You should spend about 20 minutes on this task. The graphs below provide information on global population figures and figures for urban populations...

You should spend about 20 minutes on this task. The table below presents the number of children ever born to women aged 40-44...
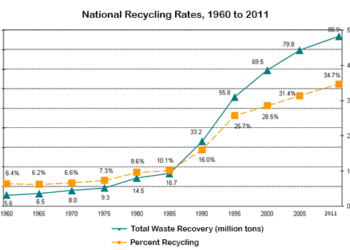
You should spend about 20 minutes on this task. The graph below shows waste recycling rates in the U.S. from 1960 to 2011....
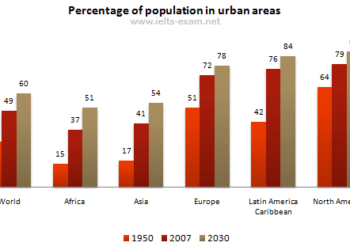
You should spend about 20 minutes on this task. The bar chart below gives information about the percentage of the population living in...
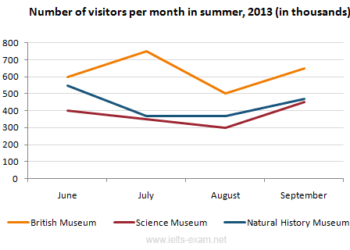
You should spend about 20 minutes on this task. The line graph below gives information about the number of visitors to three London...
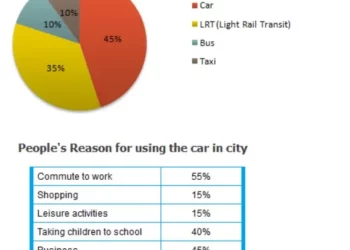
You should spend about 20 minutes on this task. The diagrams below give information on transport and car use in Edmonton. Summarise the...
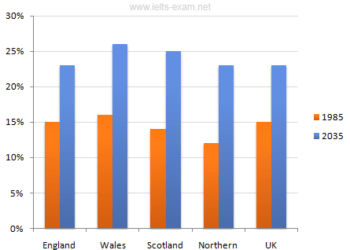
You should spend about 20 minutes on this task. The chart below gives information about the UK's ageing population in 1985 and makes...
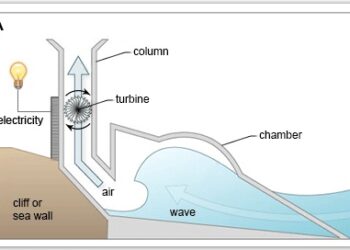
You should spend about 20 minutes on this task. The diagrams show a structure that is used to generate electricity from wave power....
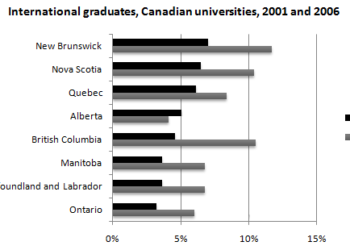
You should spend about 20 minutes on this task. The chart below shows the percentage change in the share of international students among...
9IELTS is dedicated to providing free materials and resources for IELTS conquerors. Stay constantly updated with a wide range of ultimate tips, strategies, and practice tests to crack the high-stakes IELTS exam!