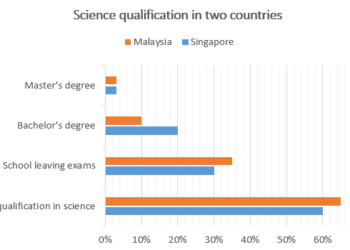
Science qualifications held by people in two countries
You should spend about 20 minutes on this task. The chart below gives information about science qualifications held by people in two countries....
You should spend about 20 minutes on this task. The chart below gives information about science qualifications held by people in two countries....
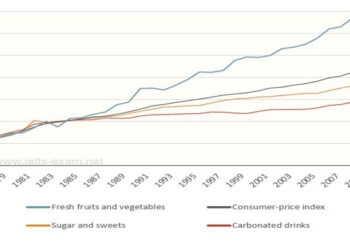
You should spend about 20 minutes on this task. The graph below shows relative price changes for fresh fruits and vegetables, sugars and...
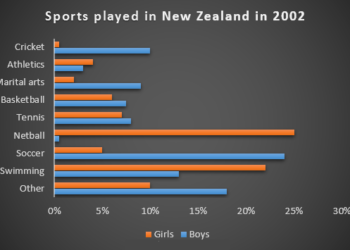
You should spend about 20 minutes on this task. The chart below gives information about the most common sports played in New Zealand...
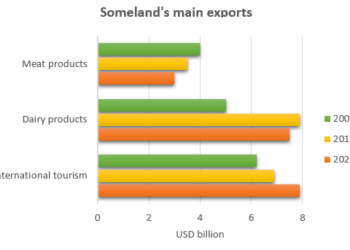
You should spend about 20 minutes on this task. The chart below gives information about Someland's main exports in 2005, 2015, and future...
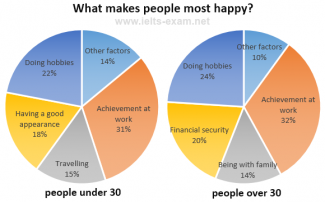
You should spend about 20 minutes on this task. The charts below show the results of a survey about what people of different...
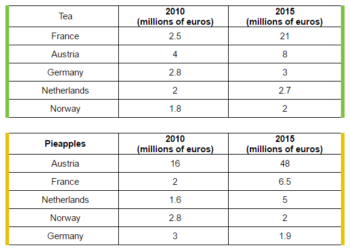
You should spend about 20 minutes on this task. The tables below give information about sales of Fairtrade*-labelled tea and pineapples in 2010...
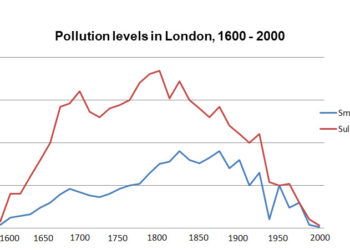
You should spend about 20 minutes on this task. The graph below shows the pollution levels in London between 1600 and 2000. Summarise...
You should spend about 20 minutes on this task. The pie chart below shows the main reasons why agricultural land becomes less productive....
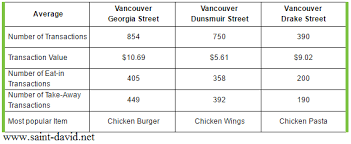
You should spend about 20 minutes on this task. The table below gives information about a restaurant’s average sales in three different branches...
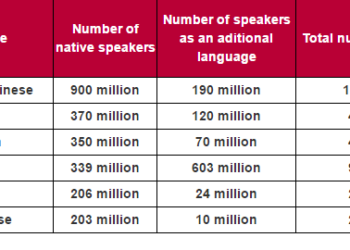
You should spend about 20 minutes on this task. The table below gives information about languages with the most native speakers. Summarise the...
9IELTS is dedicated to providing free materials and resources for IELTS conquerors. Stay constantly updated with a wide range of ultimate tips, strategies, and practice tests to crack the high-stakes IELTS exam!