Population figures for India and China
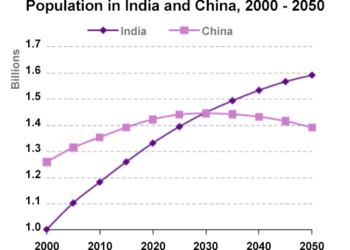
You should spend about 20 minutes on this task. The graph below shows population figures for India and China since the year 2000...
You should spend about 20 minutes on this task. The graph below shows population figures for India and China since the year 2000...
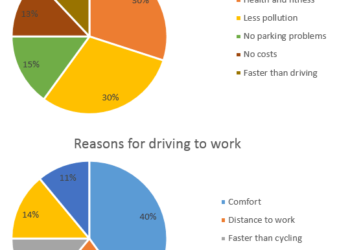
You should spend about 20 minutes on this task. The charts below show the reasons why people travel to work by bicycle or...
You should spend about 20 minutes on this task. The charts summarise the weight measurements of people living in Charlestown in 1955 and...
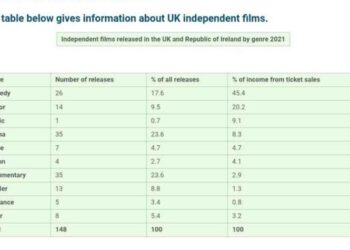
You should spend about 20 minutes on this task. The table below gives information about UK independent films. Summarise the information by selecting...
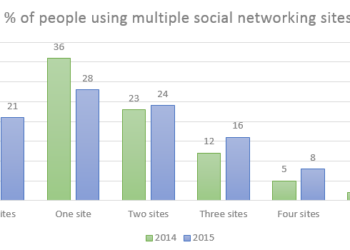
You should spend about 20 minutes on this task. The chart below gives information about the number of social networking sites people used...
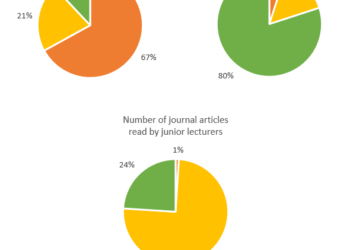
You should spend about 20 minutes on this task. The pie charts below illustrate the number of journal articles read per week by...
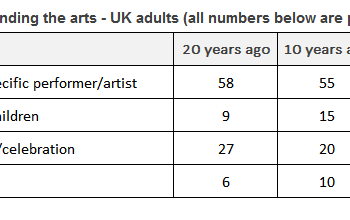
You should spend about 20 minutes on this task. The table below shows the results of a 20-year study into why adults in...
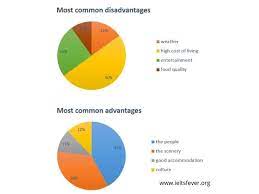
You should spend about 20 minutes on this task. The pie charts below show the most common advantages and disadvantages of Bowen Island,...
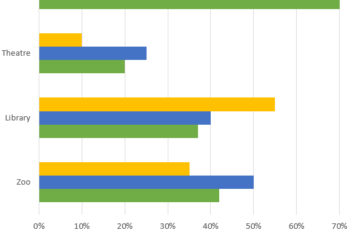
You should spend about 20 minutes on this task. The chart below shows the places visited by different people living in Canada. Summarise...

You should spend about 20 minutes on this task. The table below gives information about student enrolments at Manchester University in 1937, 1967...
9IELTS is dedicated to providing free materials and resources for IELTS conquerors. Stay constantly updated with a wide range of ultimate tips, strategies, and practice tests to crack the high-stakes IELTS exam!