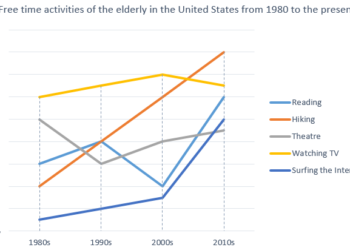
How elderly people in the United States spent their free time
You should spend about 20 minutes on this task. The graph below shows how elderly people in the United States spent their free...
You should spend about 20 minutes on this task. The graph below shows how elderly people in the United States spent their free...
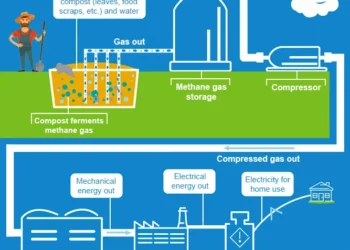
You should spend about 20 minutes on this task. The diagram below shows a possible future means of home energy production. Summarise the...
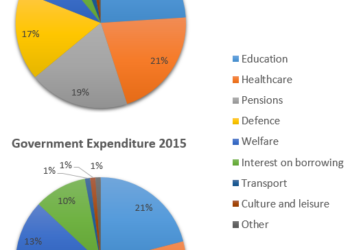
You should spend about 20 minutes on this task. The charts below show local government expenditure in 2010 and 2015. Summarise the information...
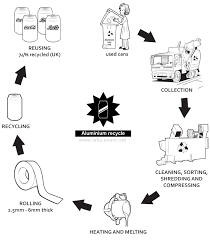
You should spend about 20 minutes on this task. The diagram below shows the recycling process of aluminium cans. Summarise the information by...
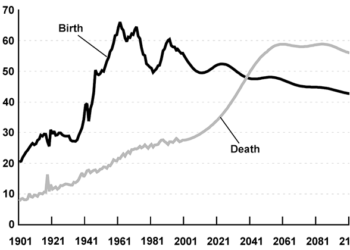
You should spend about 20 minutes on this task. The graph below gives information about changes in the birth and death rates in...
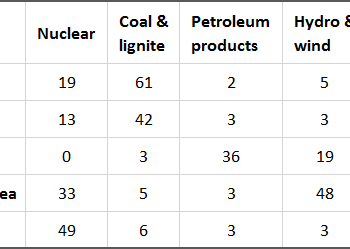
You should spend about 20 minutes on this task. The table below shows the percentage use of four different fuel types to generate...
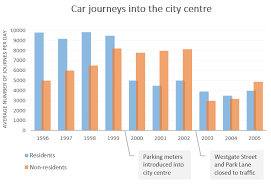
You should spend about 20 minutes on this task. The bar chart gives information about the number of car journeys into the city...
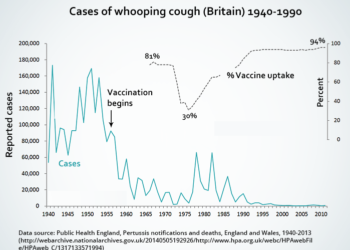
You should spend about 20 minutes on this task. The graph shows the impact of vaccinations on the incidence of whooping cough, a...
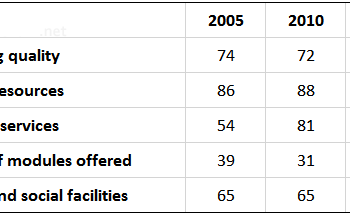
You should spend about 20 minutes on this task. The table below shows the results of surveys in 2005, 2010 and 2015 about...
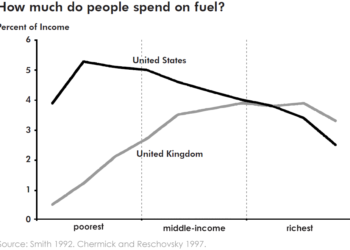
You should spend about 20 minutes on this task. The graph below gives information about how much people in the United States and...
9IELTS is dedicated to providing free materials and resources for IELTS conquerors. Stay constantly updated with a wide range of ultimate tips, strategies, and practice tests to crack the high-stakes IELTS exam!